Microsoft Copilot · PRACTICAL GUIDE
Use Copilot to review documents and check an Excel budget dashboard
Follow a source-based Copilot workflow: compare four business documents, create budget formulas, and catch an incorrect dashboard chart.
Watch the original tutorial
Open the original video on YouTube ↗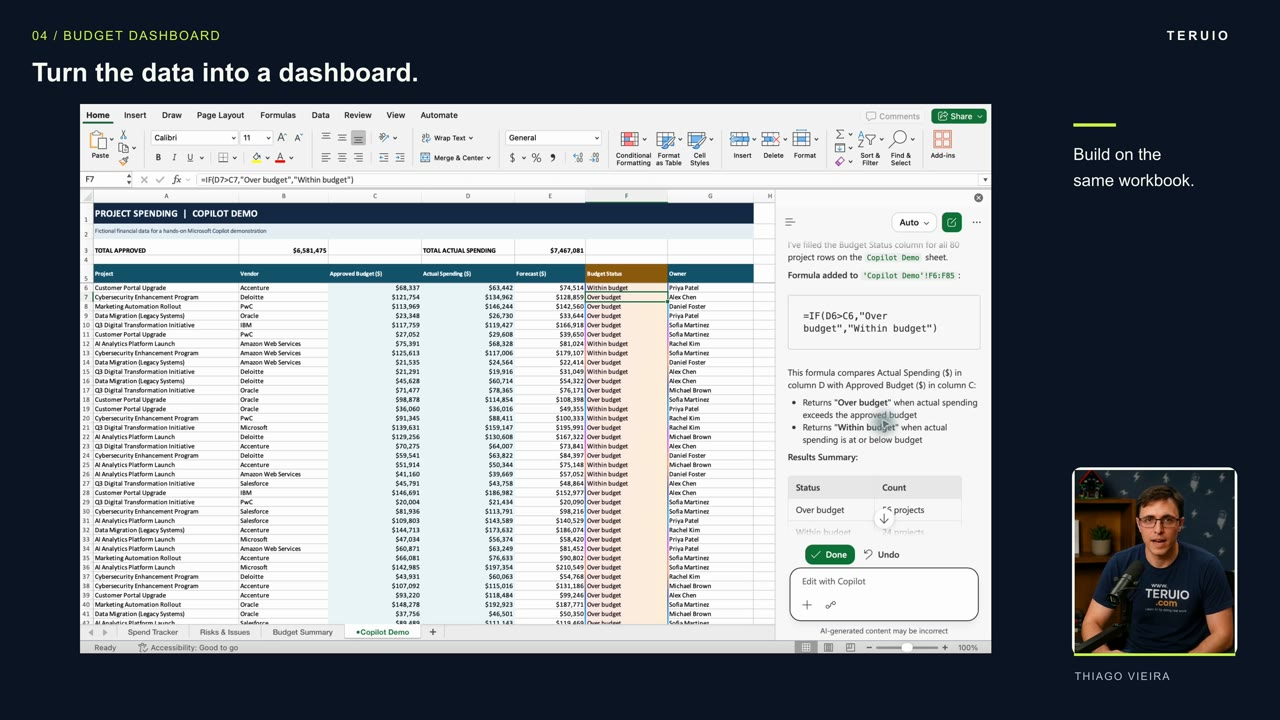
The most useful part of an AI spreadsheet workflow can be finding where the first answer is wrong. In Thiago’s tutorial, Copilot fills a budget-status column and creates a dashboard—but initially produces a pie chart with a single 100% slice. Checking the source table reveals the problem.
This guide follows the narration and examples in the original tutorial. It explains the review process without assuming the same controls or feature availability in every account.
What you’ll learn
- Ask for priorities across several business documents.
- Request ordinary Excel formulas instead of fixed labels.
- Distinguish individual spreadsheet rows from grouped projects.
- Check chart results and request a precise correction.
Prepare the information
The example uses an operations update in Word, financial information in Excel, a client letter as a PDF, and slides from a previous leadership review. For your own practice, choose information you are authorized to use and retain an unchanged copy of the workbook.
The video also opens with a voice conversation about a shared screen. That is an optional way to discuss visible information; it is separate from adding files to a notebook or editing an Excel workbook.
1. Ask for decisions across the documents
Create a notebook in the available Copilot experience and add the four relevant files as references. The tutorial’s central request is:
Based on these four documents, what are the three most important issues I should raise at the next leadership meeting? Cite the supporting sources.
This asks Copilot to connect the information rather than summarize each document independently. In the example, the issues concern the revised launch date, the effect of rework on profitability, and overdue payment or additional client requests.
Check each answer against its supporting document. Pay attention to dates: a document may describe an earlier deadline, and the current situation may have changed since it was written. Microsoft’s reference documentation explains the available ways to add notebook material; supported reference types depend on your account.
2. Request a formula-based budget status
Open the workbook containing approved budget, actual spending, and an empty budget-status column. The video uses Copilot’s side panel to edit the workbook. It does not use a COPILOT function inside a cell.
Ask it to compare actual spending with approved budget for every row. Specify that spending above the approved amount should be labeled “Over budget” and all other rows “Within budget.” Explicitly request formulas.
After Copilot fills the column, inspect results in both categories. In the demonstration, the formula bar shows an IF formula comparing the two cells. That matters because a formula can update when the source values change, while a typed label may stay the same.
Check the row references and test a changed value in your practice copy. Do not assume a correct first row proves all rows are correct.
3. Describe the dashboard precisely
The next request creates a separate dashboard with total approved budget, actual spending, the difference, and two charts. The workbook contains repeated project names, so the request also says to combine those rows for the project comparison.
There are two different questions here:
- How many individual rows are over or within budget?
- How does the combined spending for each project compare with its combined budget?
Keep those questions explicit. Counting rows and grouping projects are different operations, even when they use the same source sheet.
4. Check the result against the table
The narration reports approximately $6.58 million approved and $7.47 million spent, with a difference of $885,606. Those are the tutorial’s example results, not values expected from your own workbook. The rounded totals alone are not enough to reproduce the exact difference.
The source table has 56 rows over budget and 24 within budget. There are 80 rows in total, so the expected proportions are 70% and 30%.
The first pie chart instead shows one slice marked 100%. That visible contradiction is a reason to correct the chart before using the dashboard. The tutorial also notes that another chart overlaps the table.
5. Request and verify the correction
Describe both problems: the pie chart needs to represent the two status counts, and the comparison chart needs to move so the table remains readable.
After the revision, check the chart labels against the counts again. Inspect the dashboard formulas and their references to the source sheet. The narrated example uses SUM and SUMIF formulas.
The corrected appearance is only one part of the check. Confirm that the formulas still refer to the intended data and that repeated project names have been grouped correctly.
Troubleshooting and common questions
Why does a pie chart show 100%?
In this example, it contradicts the two-category source table. Inspect the chart’s selected data and categories. Ask for a chart based on the correct two counts, then verify the revision rather than accepting its appearance alone.
Why do the project chart and status chart have different totals?
They may summarize different units. One counts rows; the other groups rows by project. Label each view clearly and check that it answers the intended question.
Can I present the result immediately?
Review the source figures, formulas, date context, labels, and chart placement first. The lesson is to explain the outcome, inspect the result, and correct anything that does not match the evidence.


